4D Sequencing and Live Dashboards for Data Centre Construction
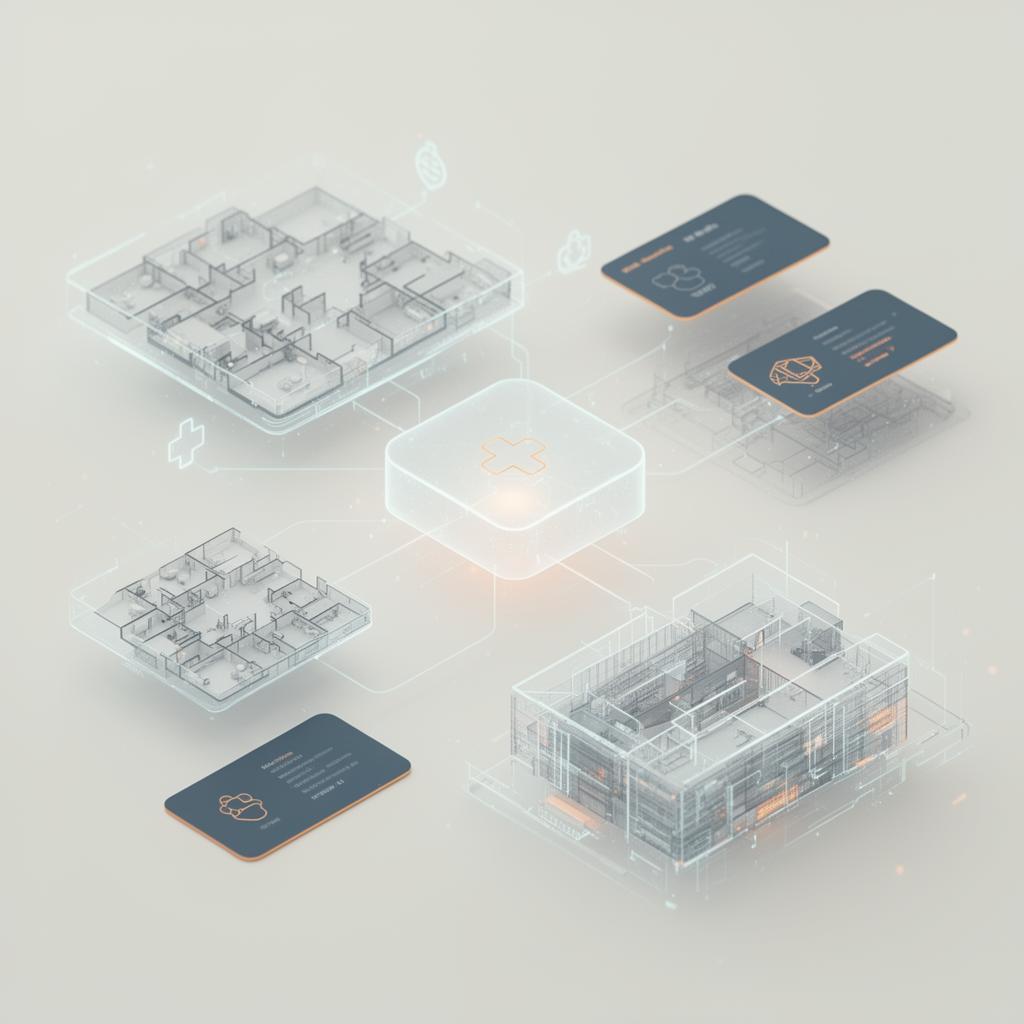
Accelerated data centre programmes need more than a coordinated 3D model. 3D construction trackers, 4D sequencing of build and logistics, facade and precast coordination, and live dashboards that combine design coordination, progress and site safety give owners and contractors one operational picture from groundbreak to handover.
Why 4D matters on data centre programmes
Data centre construction compresses substantial scope into aggressive programmes. Crane strategies, laydown areas, precast lifts, generator drops, switchgear delivery and high-risk activities all interact with live trades on a constrained site. A 4D sequence linking the federated model to the programme lets the team rehearse the build, expose programme assumptions and resolve site logistics before they become field problems.
3D construction trackers
On live builds we operate 3D construction trackers that visualise installed status against the model in near real time. Element-level status (planned, in progress, installed, commissioned) is updated from site, dashboarded against programme, and used to drive coordination meetings with concrete progress evidence rather than narrative updates.
Facade and precast coordination
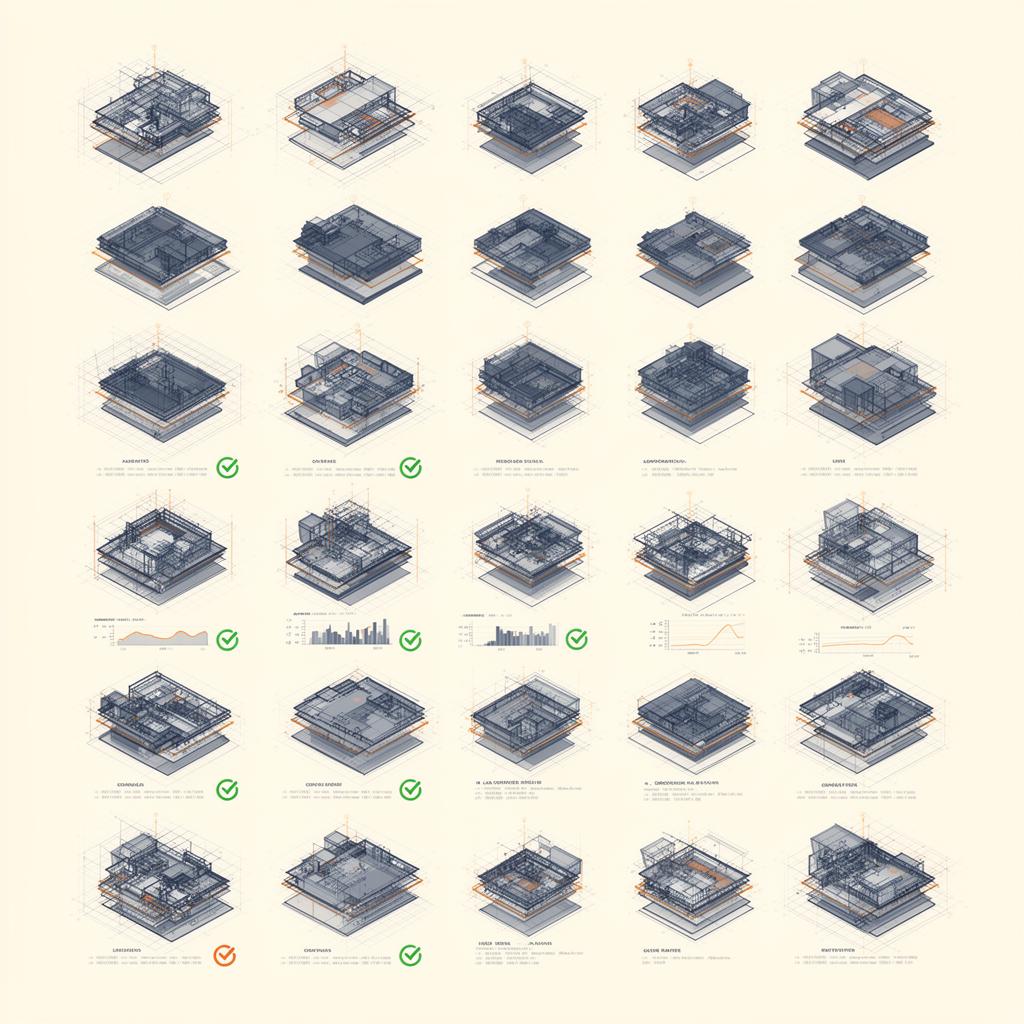
Data centre envelopes are increasingly precast and panelised. We model facade and precast assemblies in detail, coordinate them against structure and MEP penetrations, and feed sequenced lift plans directly into the 4D model. The same model supports shop documentation, setting-out and on-site verification.
Site logistics modelled, not assumed
Crane positions, laydown zones, site access, traffic management and high-risk activity windows are modelled and sequenced alongside the build. The 4D model becomes the working surface for site logistics planning, reviewed weekly with site supervisors, safety leads and trade partners.
Live project dashboards
We build Power BI and web-based dashboards that integrate design coordination metrics (model health, open clashes, RFI trends), construction progress from the 3D tracker, site safety data (HSE observations, incidents, high-risk activity status) and commissioning status into one operational picture. Project leadership sees programme, quality and safety as one connected signal rather than three disconnected reports.
From construction tracker to operational twin
The information that supports the build, structured assets, installed status, commissioning data, is the same information that supports operations. We close projects with a handover dataset and dashboard layer that the owner can carry directly into facilities management and operational digital twin programmes, rather than rebuilding the data from scratch post-PC.
Frequently asked questions
Which platforms do you use for 4D and dashboards?
Synchro and Navisworks for 4D, Revit and Rhino as authoring platforms, ACC and Revizto for federation and coordination, and Power BI and bespoke web layers for live dashboards. We match tooling to the client's existing stack where possible.
Do dashboards include site safety data?
Yes. Where the client has HSE data captured digitally, we integrate it into the live dashboard alongside coordination and progress, so safety status is visible against the same model and programme leadership already uses for delivery.
Related case studies

Need help implementing this in your projects?
We build production-grade systems, not theoretical frameworks. Let's discuss your specific challenges.